
Quality Management in Manufacturing vs Inspection Only Approaches to Defect Reduction
Jeff Zeller | September 16th, 2026
Two plants can report the same scrap rate in the same month and still be running fundamentally different operations. One of them is very good at finding bad parts before they leave the building, catching them at final inspection and dispositioning them quickly. The other has spent years narrowing the conditions that allow bad parts to be made in the first place, so the inspection station sees fewer surprises every quarter. The first is running an inspection-only approach to defect reduction, the second is running quality management, and the gap between them rarely shows up in a single week of data. It shows up over a year of tooling changes, new operators, supplier substitutions, and product launches, when one plant’s defect rate drifts and the other’s holds.
Comparing the two approaches usefully means being precise about what each one controls, where each one spends money, what each one leaves exposed, and how automated inspection has changed the boundary between them. Neither approach is inherently wrong for every plant, but choosing between them by default, rather than deliberately, is how the cost of poor quality quietly becomes a permanent line item.
What Each Approach Actually Controls
An inspection-only approach controls disposition, which means it decides which units ship, which go to rework, and which get scrapped. It operates on parts that already exist, so its leverage begins after the money for material, machine time, and labor has already been spent. Its outputs are judgments and records: conforming or nonconforming, accept or reject, with supporting measurement data attached. A quality management approach controls conditions instead, including process capability, equipment condition, work instructions, operator training, supplier inputs, and the feedback loops that connect a defect back to the mechanism that produced it. Inspection is not the opposite of quality management, which is a distinction that gets lost in most internal debates. ASQ, cited in industry guidance on quality control and inspection, frames quality control as the part of quality management concerned with fulfilling quality requirements through inspection, testing, and measurement of actual outputs. In other words, inspection is a component that a quality management system uses, not a rival system.
The practical difference is what happens after a defect is found. In an inspection-only operation, finding the defect is the end of the work, because the part is removed and the line continues. In a quality management operation, finding the defect is the beginning of the work, because the finding becomes an input to a process investigation. As QCADVISOR describes it, For example, a spike in dimensional variation can trigger a targeted gauge study, a tooling adjustment, or updated work instructions. That chain of consequences is the entire distinction, and it is also the part that is easiest to skip when the line is behind schedule.
Detection Timing and Where Defect Cost Accumulates
Defect cost is not a fixed number attached to a bad part, because it grows with every operation the part survives. A blank with a surface flaw that is caught immediately costs the price of the blank, while the same flaw discovered after machining, coating, assembly, and packaging carries all of that added value with it into the scrap bin. Push detection further out and the cost curve steepens again, because a defect that reaches the customer brings returns handling, warranty administration, containment sorting, engineering time, and the far less measurable cost of a damaged account relationship. This is why detection timing matters more than detection volume, and why counting rejects at final inspection tells you very little about how much quality is actually costing you.
The published figures on cost of poor quality make the scale concrete. CheckFlow’s operations guide estimates that a manufacturer doing ten million dollars in revenue can be losing roughly 1.5 to 2 million dollars per year through defects, rework, warranty claims, and customer complaints, which is money that appears in operating results without ever appearing as a quality line item. The same guide, citing ASQ, reports that companies with robust quality management programs can reduce cost of poor quality by 50 percent or more over three to five years, and that full implementation can cut defect rates by as much as 80 percent within nine to fifteen months. Those numbers are vendor-published benchmarks rather than guarantees, and any plant should validate them against its own baseline before building a business case. Directionally, though, they describe something inspection-only operations tend to confirm from the other side: when nothing upstream changes, the same defects keep arriving at the same station, and the inspection budget grows to match.
Sampling Risk and the Limits of Inspection Coverage
Most manual inspection is sampling, because inspecting every unit at every operation is rarely affordable at production volume. Sampling is statistically defensible when the process is stable and the defect is randomly distributed, and it becomes far less defensible when defects arrive in clusters tied to a shift change, a tool wear cycle, a specific fixture, or a single lot of incoming material. A sampling plan that misses a cluster does not fail loudly, which is the real hazard, because the paperwork still shows a passing lot. HQTS, a third-party inspection company that describes itself as having more than 25 years of experience in quality assurance, notes that inspection results are compiled into a sample report indicating whether or not the product conforms to specifications, and that report is exactly as representative as the sample behind it.
Coverage limits also constrain what inspection can conclude. HQTS describes inspectors as able to recommend adjustments to the manufacturing process, inspect and test materials used in final products, accept or reject finished items, remove products that fail specifications, and report all inspection and test data. That is a substantial mandate, but every item on it depends on the inspector having seen enough units, in enough detail, to distinguish a one-off from a trend. Human visual inspection is also subject to fatigue, lighting conditions, cycle time pressure, and honest disagreement between two experienced people looking at the same borderline cosmetic flaw. None of this makes inspection unreliable in principle. It makes inspection coverage a design decision that deserves the same scrutiny as machine capability, and it explains why many plants only discover their true escape rate through a customer complaint.
Organizational Ownership and the Inspector Accountability Problem
Inspection-only operations tend to concentrate quality accountability in the people who catch defects rather than the people who create them. That arrangement is administratively tidy and operationally corrosive, because production is measured on throughput while quality is measured on containment, and the two functions end up negotiating rather than collaborating. When quality lives entirely with the inspection department, upstream teams have little reason to fund process changes, since the defects they generate are absorbed downstream and reported as a quality metric rather than a production one. The inspector, meanwhile, holds responsibility for outcomes determined almost entirely by decisions made before the part reached the station.
Quality management distributes that accountability by making process owners responsible for the conditions their operations produce, with inspection data serving as shared evidence rather than a departmental scorecard. This works only when the data reaches process owners fast enough to act on, which is a routing problem as much as a cultural one. One guide to quality control and inspection in manufacturing describes the alternative to end-of-shift reporting plainly: Exception alerts go directly to managers when anomalies arise, enabling immediate intervention from any device rather than waiting for a shift summary report. The organizational effect of that shift is larger than the technical one, because a defect signal that arrives while the machine is still running belongs to the process owner, while a defect signal that arrives the next morning belongs to nobody in particular.
When Inspection-Only Is a Defensible Operating Choice
There are production situations where inspection-only is the rational allocation of limited engineering attention rather than a failure of ambition. Very low volume and high mix work, prototype and short-run fabrication, and one-off custom builds may never accumulate enough repetitions for statistical process control to say anything meaningful, so verifying each finished unit is both simpler and more useful. Operations where the process is genuinely stable and capable, with a long history of low variation, may also find that additional prevention investment returns less than maintaining a competent final check. Contract manufacturers receiving finished goods for acceptance often have no access to the producing process at all, which makes inspection the only lever available to them.
Inspection-only also remains defensible as a deliberate interim state during a capital freeze or a plant transition, provided the operation records enough detail to convert into process work later. The critical test is whether inspection findings are being filed or being used. A plant that logs a rise in dimensional variation and does nothing with it is running inspection-only by outcome, even if it owns a quality manual. A plant that treats the same signal as a prompt for a gauge study, a tooling adjustment, or revised work instructions has already crossed into quality management, regardless of how modest its formal system looks on paper.
What Inspection Must Still Do Inside a Quality Management System
Prevention does not retire inspection, and quality management systems that assume it will tend to lose the verification layer that keeps them honest. Since quality control is the part of quality management concerned with fulfilling requirements through inspection, testing, and measurement of actual outputs, inspection is the mechanism that confirms whether prevention is actually working on the parts leaving the line rather than only in the control plan. It provides the measurement data that process capability studies depend on, the containment capability that protects customers when something unexpected changes, and the independent check on the assumption that a validated process stays validated.
The difference is what inspection is asked to produce. Inside a quality management system, inspection generates process signals with enough context to trace a defect to a machine, shift, fixture, or material lot, and it routes anomalies to the people who can intervene immediately instead of waiting for a summary report. That is also why quality data tooling has become an investment category in its own right, with CheckFlow citing Fortune Business Insights figures placing the quality software market at 12.52 billion dollars in 2025 and projecting 31.54 billion dollars by 2034 at a compound annual growth rate of 10.81 percent. The benchmark reductions in cost of poor quality and defect rate cited earlier assume this kind of connected loop, because a 50 percent reduction over three to five years or an 80 percent defect reduction inside a year requires inspection findings to change process behavior repeatedly, not once.
Automated Visual Inspection as a Bridge Between Detection and Process Feedback
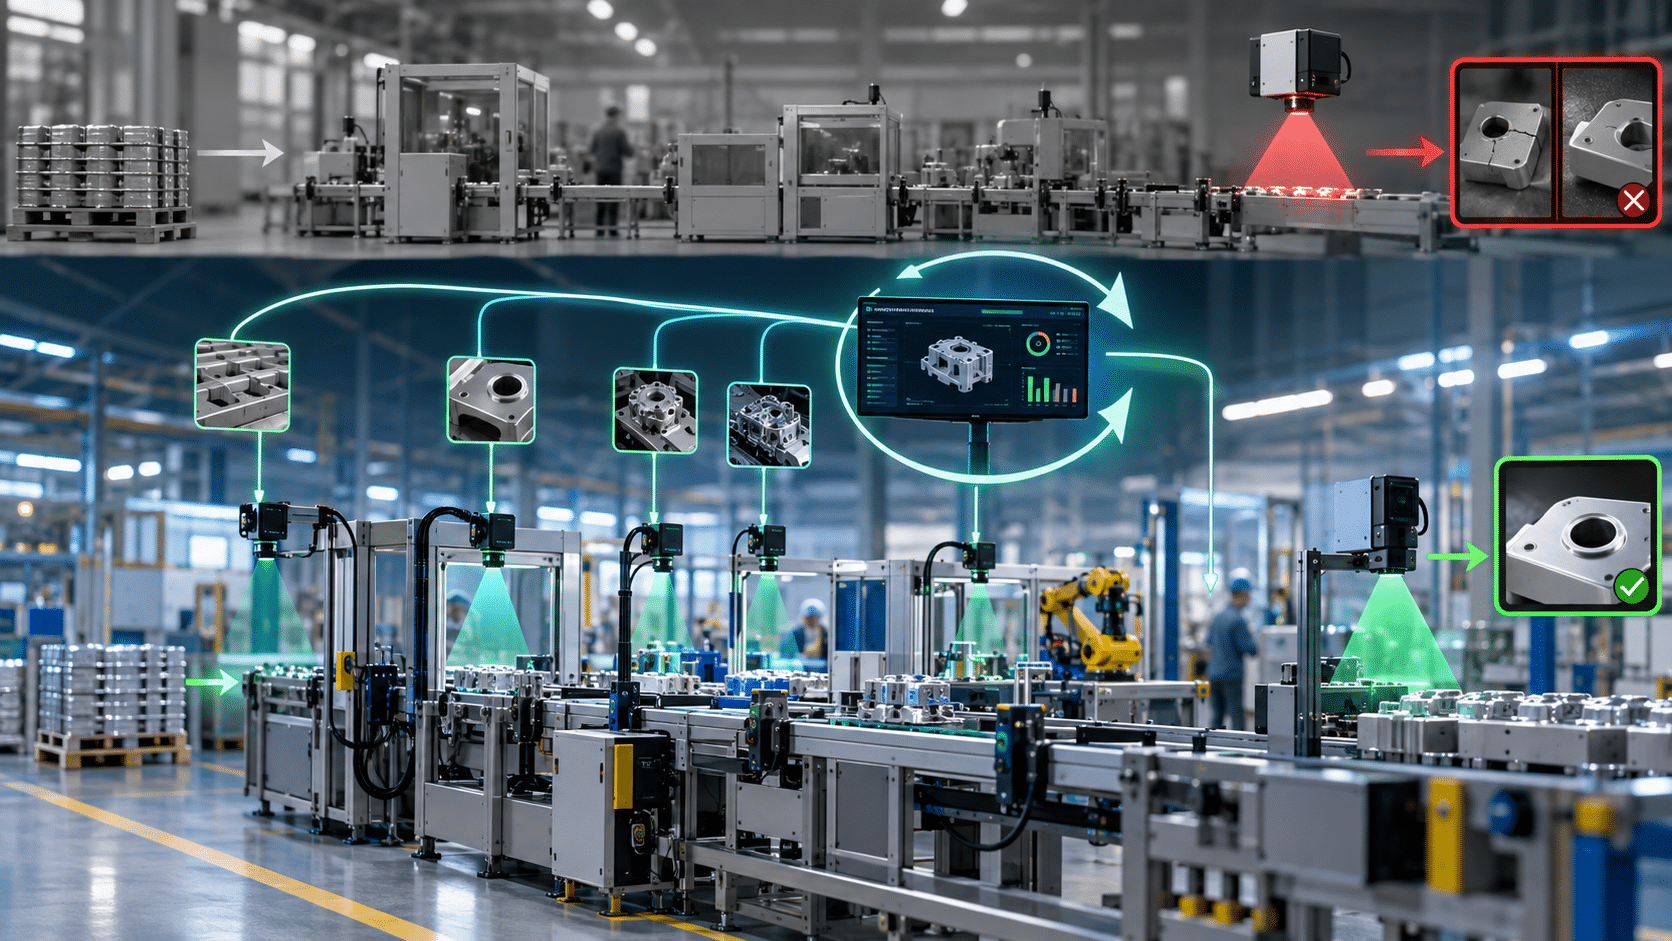
The historical reason plants stayed inspection-only was economic, since continuous coverage and rapid process feedback both required more inspection labor than the defect rate justified. Automated visual inspection changes that arithmetic by decoupling coverage from headcount, because a camera watching every unit at a station produces a continuous data stream rather than a periodic sample. That stream is what converts detection into process feedback, since defect timing, location, and type can be correlated with the machine, shift, or lot that produced them instead of being averaged into a daily reject count. Computer vision in this role is less a replacement for inspectors than a way to give process owners a signal they never previously had at full coverage.
Matroid supports this pattern with no-code computer vision built for enterprise teams, where users can detect and classify defects, objects, assemblies, hazards, and events across production and operational monitoring. Matroid software works with any image or video hardware, which matters in brownfield plants where cameras were installed over many years for different purposes and replacing them is not on the table. The platform includes a custom detector studio, MLOps architecture, quick training, and analytics from video streams, so a detector built for one defect type can be trained, deployed, monitored, and revised as products and tolerances change. No-code does not mean no engineering judgment, and defining what counts as a defect, validating detector behavior against known samples, and deciding how findings feed corrective action remain quality engineering work.
The upside reported in the market can be substantial when detection is wired into process response rather than left as a sorting function. TradeAider, writing on the role of inspection and quality control, reports an automotive manufacturer that achieved an 85 percent reduction in defects and saved 2.3 million dollars annually after deploying automated quality management. Results like that depend heavily on the specific process, the defect modes involved, and the discipline of the corrective action loop behind the technology, so they should be read as an indication of what the pattern can produce rather than as an expected outcome.
Metrics That Reveal Which Approach Is Working
Reject rate at final inspection is the least informative quality metric a plant can lead with, because it rises when inspection improves and falls when inspection gets lazy. The metrics that actually distinguish prevention from containment start with escaped defects reported by customers, measured in parts per million shipped, since that number is indifferent to how hard the inspection department worked. First pass yield matters next, because it captures how much output required no intervention at all, and a rising reject rate paired with a rising first pass yield tells a very different story than a rising reject rate alone.
Two further measures separate the approaches decisively. The first is the ratio of appraisal spending to prevention spending, since an operation that keeps adding inspection hours while prevention funding stays flat is inspection-only regardless of what its documentation claims. The second is elapsed time from defect detection to a completed process change, which is the clock that determines whether inspection findings become improvements or archives. Cost of poor quality remains the number to report upward, given that the published benchmarks describe 50 percent or greater reductions over three to five years, and defect rate reductions of up to 80 percent within nine to fifteen months, against a baseline that in a ten million dollar operation can run between 1.5 and 2 million dollars annually.
Verdicts by Production Situation
The right answer depends on volume, repetition, defect consequence, and how much access you have to the producing process, so the comparison resolves differently across common situations.
- High volume, repetitive production with meaningful defect cost: quality management, with automated inspection supplying the coverage and the process signal.
- Low volume, high mix, or prototype work: inspection-led verification, with findings still logged in enough detail to support process work later.
- Incoming or acceptance inspection where you do not own the process: inspection by necessity, paired with supplier data sharing and corrective action expectations.
- Safety-critical or regulated output: quality management for control, with independent inspection retained as verification and containment, never removed.
- Stable, capable processes under cost pressure: maintain prevention discipline before trimming inspection, since sampling gaps surface as customer escapes rather than internal rejects.
Across all of these, the useful question is not whether to inspect but whether inspection findings reach the process fast enough to change it. Plants that answer yes tend to spend less on quality every year, while plants that answer no tend to spend more and see the same defects return. If your current inspection data is telling you where defects occur but not why, a demo of automated visual inspection is a reasonable next step toward closing that loop.
TL;DR: Plants that rely solely on inspection catch defects after they occur, while true quality management reduces the conditions that create them, and the practical difference between the two becomes measurable only across a full year of tooling changes, new operators, supplier shifts, and product launches.
Building Custom Computer Vision Models with Matroid
Dive into the world of personalized computer vision models with Matroid's comprehensive guide – click to download today