Evaluating and Refining Computer Vision Detectors

Tucker Cullen | June 26th, 2025
Matroid makes computer vision accessible, enabling anyone to build, deploy, and iterate on custom visual detectors without writing code. Whether you’re inspecting aluminum extrusions for speed tears or scanning shipping yards for missing containers, Matroid turns complex visual AI into something fast, flexible, and easy to use. However, creating a great detector isn’t a one-and-done task. Much like training a new employee, your detector learns best with clear examples, consistent feedback, and regular check-ins to track progress. In this post, we’ll walk through how to evaluate that progress using the same metrics our platform provides automatically, so you can build detectors that get smarter, sharper, and more reliable over time.
Overview
Matroid’s platform empowers you to create custom “detectors” using AI Computer Vision to identify and classify virtually anything in visual imagery, whether it’s specific material defects, verifying the correct installation of a component, or detecting human activity in a particular location. If something is visible to the human eye, chances are you can train a detector to recognize it.
Think of a detector as a new team member on the factory floor, just one who never sleeps and can review thousands of images per hour. Just like a new employee, your detector needs clear instructions, examples of what to look for, and consistent feedback to improve. The more situations you expose it to, the sharper its judgment becomes.
Building an effective detector isn’t a one-and-done task; it is an iterative process. It involves continually refining and retraining your model to improve its performance over time. Much like training a new employee, your detector learns best with clear examples, consistent feedback, and regular check-ins to track progress.
But what does it actually mean to “improve” a detector? And how can you tell if a new version is better than the previous one? Matroid simplifies this by automatically calculating and visualizing key performance metrics widely used in machine learning – including precision, recall, F1 score, and mean Average Precision (mAP).
Here we discuss what these indicators are demonstrating and how to use them to guide your detector iteration.
Detector Evaluation Metrics
Core Metrics
When evaluating detectors, the two key metrics to focus on are precision and recall. To understand these, it’s essential to know how detection results are categorized and understand how detector confidence thresholds work.
If you’re new to computer vision, imagine testing an intern on identifying product defects from photos. Every time they point to a defect, you check: Were they right? Did they miss any? This is essentially what precision and recall measure.
Imagine you’ve trained a detector to identify a specific defect in manufactured parts. You test it on new images or video frames and classify the outcomes as follows:
True Positive (TP): The detector correctly identifies a fundamental defect.
False Positive (FP): The detector flags something as a defect, but it’s actually not.
True Negative (TN): The image contains no defects, and the detector correctly makes no detection.
False Negative (FN): A genuine defect is present, but the detector fails to identify it.
Detection Confidence and Thresholds
Before calculating precision and recall for a detector, you need to choose a confidence threshold at which to make that calculation. A Matroid detector will output a confidence score for every detection it makes. This score is between 1% – 100%, which denotes how confident the detector is about the detection. When you choose a “confidence threshold, ” you specify the minimum confidence level required to keep a detection.
Say your detector incorrectly flags something as a defect that is not a defect with a confidence score of 45%. If you selected a confidence threshold of 40%, this detection will be recorded as a false positive. If, however, you had chosen a threshold of 50%, this detection would not have surfaced, and the image that contained it would count as a true negative in your calculations.
Setting a threshold is like telling your intern: “Only tell me you see a defect if you’re at least 80% sure.” Lower the threshold, and they’ll raise more flags (some incorrect). Raise it, and they’ll speak up less, but might miss something important.
Recall
Recall measures how well your detector finds all the items it’s supposed to detect. For example, if you run your detector on 100 images containing defects and the detector finds 90 defects, your recall is 90%. High recall means the detector is good at not missing anything important, but it doesn’t tell you anything about the amount of “false positives”.

Recall is all about completeness. If you’re running safety inspections, high recall ensures the model sees everything, even if some of what it sees turns out not to be an issue.
Precision
Precision lets you know how well your detector separates real detections from false indicators. If your detector flags 100 defects and 80 of them are real defects (true positives), you have 80% precision. High precision means most of the detector finds are relevant, with fewer false alarms.

Precision, by contrast, is about accuracy. It answers: “When the detector speaks up, is it usually right?” For high-stakes but low-frequency defects, precision can help you avoid panic over false alarms.
Additional Metrics
Precision and recall are often all you need when evaluating detector performance. But in case you want to dive deeper – Matroid also automatically calculates other, more complex metrics that provide different perspectives on performance, such as F1 score and mAP.
F1 Score –
The F1 score combines precision and recall into a single number. It helps you balance the trade-off between catching everything (recall) and accuracy (precision). A high F1 score means your detector is both thorough and trustworthy. The formula for recall is:
If precision and recall are like two employees with different strengths, F1 is your way of hiring the one who’s great at both.
mean Average Precision (mAP) –
mAP is a more complex, comprehensive measure that looks at how well the detector performs across different confidence levels and object types. It is calculated by averaging the precision values at various recall levels for each label and then averaging across all labels. mAP gives you a big-picture view of overall detector quality. It is often helpful as a quick check when comparing two different detectors since it provides a condensed performance summary across multiple labels and thresholds.
mAP is like a final grade across all tests, averaging every subject, every quiz, every effort. It’s useful when comparing students (detectors) across the whole semester, not just one assignment.
Viewing and Interpreting Metrics In Matroid
These metrics we discussed above are automatically calculated as part of the Matroid detector training process. Depending on the size of your dataset, a certain number of images you annotated for visual inspection when creating your detector are set aside for detector validation. The metrics calculated on this validation set can be seen in a trained Matroid detector’s “Analyze” tab (the leftmost tab on the detector page).

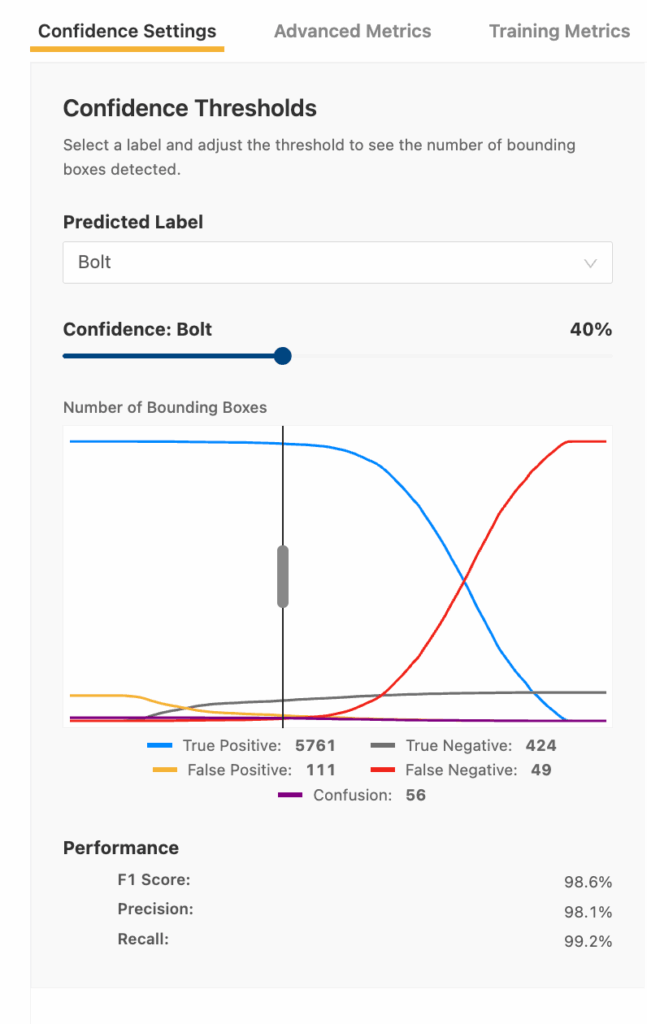
You don’t need to be a data scientist to understand your detector’s performance. Matroid presents everything in clean dashboards, so you can make data-driven decisions without needing to crunch formulas.
For example, say you have a detector that can detect “Bolts.” You can enter the analyze tab for that detector and use Matroid’s built-in confidence slider to quickly compare the detector’s precision, recall, and F1 score at any threshold. You can use this tool to quickly hone in on the best threshold for deploying that detector in a live environment.
This slider lets you simulate real-world decisions. Do you want a detector that catches every bolt, even at the risk of flagging extras? Or one that only calls out bolts that it’s certain about? You get to choose the sweet spot based on your priorities.
Your “optimal” threshold choice depends on your goals and tolerances. Oftentimes the goal will be a balance between precision and recall (i.e. maximizing the F1 score). However, perhaps a particular defect is a safety critical issue that can’t be missed, even if it means sifting through more false flags. In that case, you would want to maximize recall even at the expense of precision. The opposite could also be true – perhaps a few slip-throughs are acceptable, but you don’t want to waste operators’ time responding to false flags (in which case you want to optimize for precision).
You also can view a confusion matrix for a detector in Matroid’s “advanced metrics” tab. A confusion matrix plots the number of TPs, FPs, FNs, and TNs for each label in a single heatmap, so you can quickly see where the detector is getting “confused” (i.e., where the detector is mixing up or missing detections).
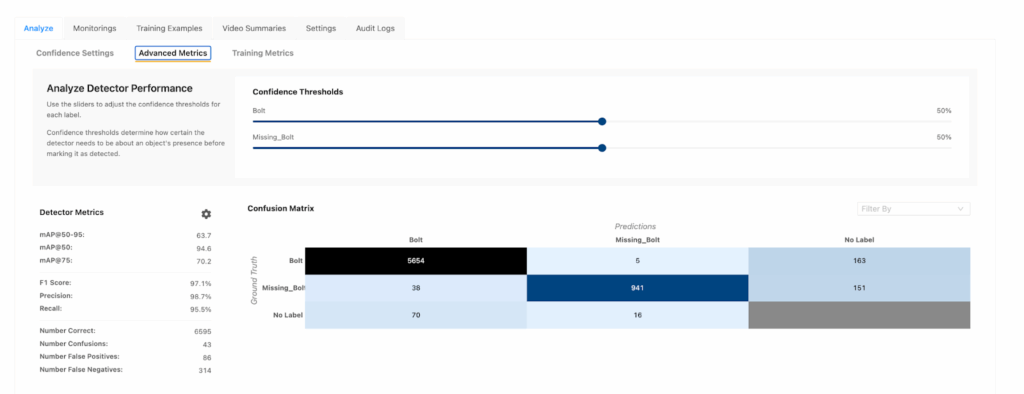
Clicking on a given box in the confusion matrix will display examples from the validation set that fall into that category. The confusion matrix can help provide a better qualitative understanding of what confuses the detector.
This is like a report card showing which test questions your detector struggled with. Did it confuse one defect type with another? Did it miss smaller or darker examples? The confusion matrix doesn’t just show scores; it tells the story of where to improve next.
Running Your Own Analysis
You may want to run a detector against a video or image “test” dataset that you curate yourself and calculate these same detector performance metrics on that dataset. This can be done by receiving detection results using Matroid’s API – either by pulling detection results from a Matroid monitoring or by directly running a detector on images programmatically through Matroid’s “classify image” API.
When to Tune Thresholds vs Retrain Your Detector
As we have seen here, there are multiple metrics you can use to hone in on the optimal confidence threshold at which to deploy your trained Matroid detector. This confidence threshold is never set in stone – you can adjust it post-deployment to better balance the tradeoff between true positives and false positives based on your evolving needs.
If you’ve already optimized the threshold but still aren’t achieving the desired performance, it’s likely time to retrain the detector to improve its baseline accuracy. This can be done through providing feedback to the detector, and/or curating a more diverse, higher-quality dataset.
Sometimes tweaking the detector’s threshold is enough, like adjusting the sensitivity dial. Other times, you need to go back and re-teach the fundamentals with better examples. That’s when retraining comes in.
With each new version of your detector, the same core metrics—precision, recall, etc.—can be used to evaluate progress and compare against previous iterations. These metrics serve as valuable benchmarks to help ensure you’re moving in the right direction during the detector development process.
About the Author
Tucker Cullen is a Deep Learning Field Engineer here at Matroid, working on the front lines of integrating computer vision solutions across some of the world’s largest industries. While he’s waiting for his models to train, he can be found running mountain trails or exploring California’s incredible landscapes by bike.
Building Custom Computer Vision Models with Matroid
Dive into the world of personalized computer vision models with Matroid's comprehensive guide – click to download today