
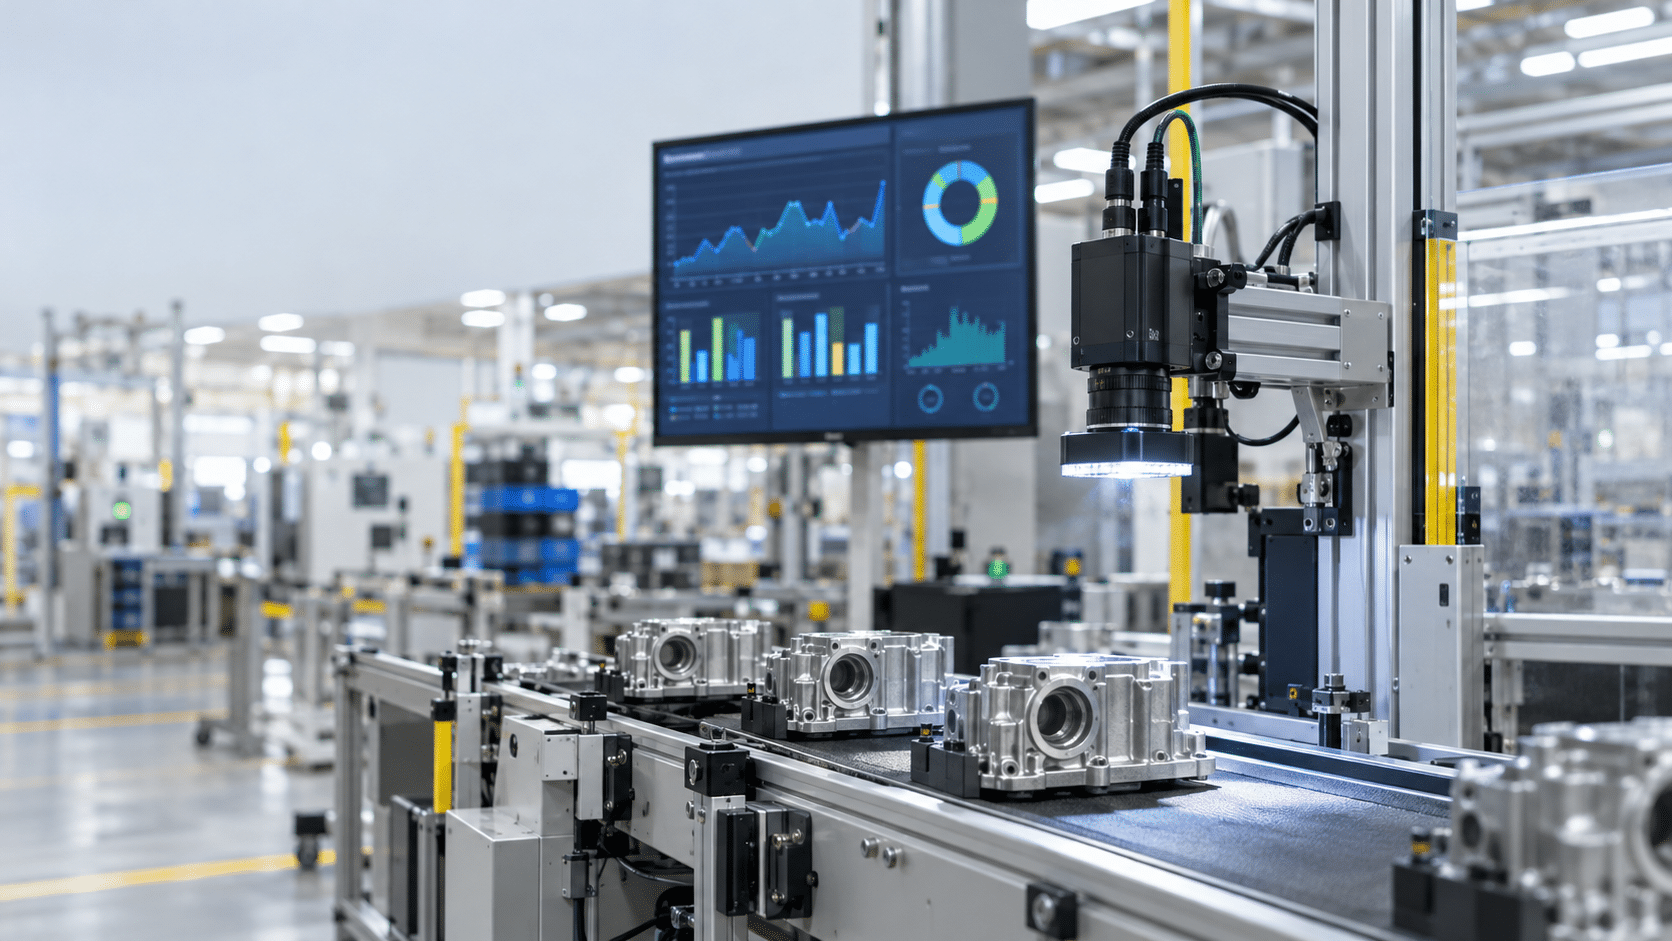
Human inspectors catch roughly 80% of defects on average, the vendor-reported baseline that inspection software companies use as their comparison point. Vendors selling AI-powered inspection systems report accuracy figures north of 99% for the same task, and that gap is the reason so many operations teams are looking hard at automated visual inspection heading into 2026. The numbers are real, but they come from a handful of vendor case studies and one or two industry reports rather than a single consolidated 2026 benchmark, so it’s worth knowing exactly what each figure measures and who is reporting it before using it to justify a budget.
This matters for anyone evaluating no-code computer vision production line use cases right now, whether the goal is defect detection on a production line, safety monitoring, or SOP conformance checks. The statistics below come from vendor-published data and a couple of named industry reports. Where the data runs out, that gap is called out directly rather than papered over, because knowing what isn’t measured yet is as useful as knowing what is.
Automated Quality Inspection Statistics for 2026
The baseline comparison starts with human performance. Manual visual inspectors typically catch around 80% of defects in manufacturing visual inspection settings, a limitation tied to fatigue, inconsistent attention over long shifts, and the simple fact that some defects are hard for the human eye to catch reliably at line speed. Overview.ai, an inspection software vendor, reports that its customers saw detection rates improve from that 80% baseline to 99.5% after switching to its AI-powered system, and the company markets 99%+ detection accuracy as a general claim for AI-powered inspection.
The technology choice inside “automated inspection” matters too. iFactory, another inspection software vendor, reports that rule-based machine vision, the older approach that flags defects using fixed thresholds and programmed rules, tops out at roughly 85% detection accuracy. AI models trained on production data, using deep learning rather than fixed rules, routinely reach 99% or higher according to the same source.
iFactory breaks that comparison down by defect type, and the gap varies depending on what’s being inspected. Surface scratches went from 82% detection with rules-based vision to 99.6% with an AI model. Pits and porosity moved from 76% to 99.1%. Colour deviation improved from 88% to 99.8%. Burrs and edge defects rose from 80% to 99.3%. Assembly checks improved from 85% to 99.5%, and label verification, already the strongest category for rules-based systems, moved from 93% to 99.9%. The pattern across every category is the same: AI models close most of the gap that rule-based systems leave open, and they close it more on defect types that are visually subtle, like porosity and colour deviation, than on ones that are already fairly binary, like label verification.
The False Positive Problem Behind Accuracy Claims
A detection accuracy figure by itself doesn’t tell you how disruptive a system is on a real production floor. iFactory specifies that a production-grade AI inspection system needs a false positive rate of 0.5% or lower running concurrently with 99% or higher detection accuracy, and treats both numbers as required together, not one or the other.
The reason that pairing matters becomes clear with a simple example. At a 2% false positive rate running on a line producing 1,000 units per hour, the system generates 20 false rejections every hour. Those are good parts pulled off the line, sent for rework or manual review, and creating exactly the kind of disruption the inspection system was supposed to eliminate. A vendor reporting 99% accuracy without also reporting the false positive rate is giving you half the picture, since a high-accuracy, high-false-positive system can create more operational drag than the manual process it replaces.
iFactory’s own reported figures show what a tighter spec looks like in practice: on surface defect detection for metals and plastics, covering scratches, pits, and colour deviation, its models reportedly hit 99% to 99.8% detection with a false positive rate at or below 0.5%. That’s a useful reference point, but it’s a single vendor’s reported figures on a specific defect category, not an independent or cross-vendor benchmark. No source in the current research pool offers a third-party test of false positive rates across multiple inspection vendors, which means anyone comparing systems still has to ask each vendor for that number directly rather than assuming it matches the accuracy headline.
ROI Timelines Reported for Automated Inspection
Two sources give meaningfully different answers on how fast automated inspection pays for itself, and the difference comes down to what each one is actually measuring. Overview.ai reports that its customers achieved ROI within 6 to 9 months, alongside a 5 to 10x increase in inspection throughput and a 90% reduction in customer complaints, the kind of production line efficiency gain vendors tend to headline in their ROI claims. Those are strong numbers, but they describe specific deployments on Overview.ai’s own platform, with all the throughput and complaint-reduction gains bundled into a single return calculation.
Hammer-IMS, describing automated inspection more generally as a category rather than a single vendor’s results, frames ROI as typically achievable within 1 to 2 years, based on tracking KPIs like detection accuracy and throughput over time. That’s a longer and more conservative timeline than the vendor-reported figure, and it likely reflects a broader averaging across deployments with different starting conditions, line speeds, and defect complexity, rather than a curated set of best-case customer outcomes.
The practical takeaway is not that one number is right and the other wrong. A single vendor’s fastest customer results and a category-wide estimate answer different questions. If you’re budgeting for a pilot, the 1 to 2 year range from Hammer-IMS is the more conservative planning assumption. If a vendor quotes something closer to Overview.ai’s 6 to 9 month figure, ask what throughput increase and complaint reduction numbers underpin that specific claim, since ROI speed tracks closely with how much of the operation the system actually touches.
What Is Driving Adoption of Automated Inspection Now
A 2025 industry report cited by Hammer-IMS found that 95% of manufacturers plan to use AI and machine learning to enhance product quality within the next five years. That figure is dated to 2025, not 2026, but it signals a near-universal shift in intent across the manufacturing sector rather than a niche adoption trend.
Part of what’s pushing that shift is a labor availability problem. As of mid-2025, there were over 415,000 open manufacturing jobs nationwide in the U.S., a gap that makes skilled quality inspector roles and other production-line positions harder to fill. Automated inspection doesn’t require replacing every inspector, but it does give operations teams a way to maintain consistent quality checks and support production line efficiency when headcount for manual review is hard to staff.
For teams weighing whether an automated system is worth the operational lifespan investment, Hammer-IMS reports that systems can operate effectively for 7 to 10 years with proper maintenance, calibration, and periodic AI model updates. That’s a meaningful planning horizon, and it assumes ongoing model updates rather than a one-time deployment that runs unchanged for a decade.
On the implementation side, iFactory reports that training an AI inspection model for common surface defects typically takes three to four weeks from camera installation to a production-ready model: roughly a week for hardware install and initial image capture, two to three weeks for labeling training data and training the model, and a final week for validation on a held-out test set before deployment. Complex multi-class models, or parts with multiple inspection surfaces, can extend that to six to eight weeks. That timeline is specific to one vendor’s reported process, but it gives a realistic order of magnitude for what a pilot program actually takes before it’s evaluated against production data, the kind of validation window teams working toward zero-defect manufacturing typically plan around.
Where the 2026 Statistics Stop Short
None of the sources behind these figures offer a consolidated 2026-dated market-sizing or adoption-rate statistic. The 95% adoption figure and the 415,000 open jobs figure both trace back to a 2025 industry report, not a 2026 dataset, so anyone citing a hard 2026 market number should treat it as an extrapolation rather than a confirmed figure until an updated report is published.
There’s also no per-vertical breakdown in the current data. None of the available sources report accuracy or ROI figures specific to aerospace, food and beverage, electronics, or medical device manufacturing. The defect-type comparisons above cover general categories like surface scratches and colour deviation, not industry-specific benchmarks, so a reader in aerospace or food and beverage shouldn’t assume the same accuracy or ROI numbers apply directly to their vertical’s defect types and tolerances.
The false positive figures cited earlier come from a single vendor, iFactory, with no independent or cross-vendor benchmark available to confirm whether that 0.5% false positive spec is typical across the industry or specific to that platform’s models.
Every accuracy and false positive figure discussed here comes from single-station machine vision, meaning inspection at one point on a line using one camera or sensor setup. None of the current sources report statistics for video-based or camera-network-wide inspection, where multiple cameras across different line zones or facility areas feed detectors simultaneously. That’s a relevant gap for any enterprise team evaluating a camera-agnostic, multi-stream visual AI platform, since single-station numbers don’t automatically scale to network-wide deployments.
Finally, every cost and ROI figure in the research pool is manufacturing-specific. No source addresses the cost of inspection errors in non-manufacturing contexts like security monitoring, compliance documentation, or facilities management, even though visual AI is increasingly used in those settings. Anyone evaluating automated visual inspection or video stream monitoring for a security, compliance, or facilities use case should treat the manufacturing ROI and accuracy figures above as directional at best, not as a direct estimate for their own error costs.
What the Numbers Justify Doing Now
The strongest evidence in this data set covers a specific, narrow claim: on common surface defects, like scratches, pits, and colour deviation, well-trained AI models can reach 99% or higher detection accuracy while holding false positive rates at or below 0.5%. That paired accuracy and false positive figure comes from iFactory alone, but it sits alongside the 99%+ accuracy figures Overview.ai reports independently, which makes it specific enough to justify piloting automated inspection on a defined defect set where this kind of data already exists. A pilot scoped to a known defect category, with both accuracy and false positive rate tracked from day one, is a reasonable next step for a manufacturing quality team weighing 2026 investment.
Committing to a specific ROI timeline for a specific industry vertical is a different decision, and the current evidence doesn’t support it yet. With no per-vertical accuracy or ROI benchmarks and no cross-vendor false positive data, a team in aerospace, medical devices, or food and beverage doesn’t have the data to hold a vendor to a fixed payback period tied to their specific defect profile. The reasonable move is to pilot against your own defect set and measure your own ROI rather than anchor on someone else’s 6-to-9-month or 1-to-2-year figure.
What would change this picture is an independently verified 2026 dataset that covers false reject rates across multiple vendors and extends the accuracy data into camera-network-wide and non-manufacturing deployments. Until that exists, the vendor-reported figures above are a reasonable starting point for scoping a pilot, not a guarantee of results. Matroid’s no-code computer vision platform works with any image or video hardware and lets teams create detectors that detect and classify defects, objects, assemblies, hazards, and events, using a detector studio, MLOps architecture for managing models at scale, fast training on a defined dataset, and analytics generated directly from video streams. That combination is built for exactly the kind of scoped, defect-specific pilot the current data supports, whether the goal is a single-station defect check across common production line use cases or monitoring across a broader camera network.
TL;DR
Vendor data shows AI-powered inspection systems reporting accuracy above 99% versus roughly 80% for human inspectors, but these figures come from scattered vendor case studies and a few industry reports rather than one consolidated 2026 benchmark, so evaluators should check what each stat actually measures before using it to justify a purchase.
Building Custom Computer Vision Models with Matroid
Dive into the world of personalized computer vision models with Matroid's comprehensive guide – click to download today