
Automated Visual Inspection Systems vs Manual Line Checks for Defect Escapes
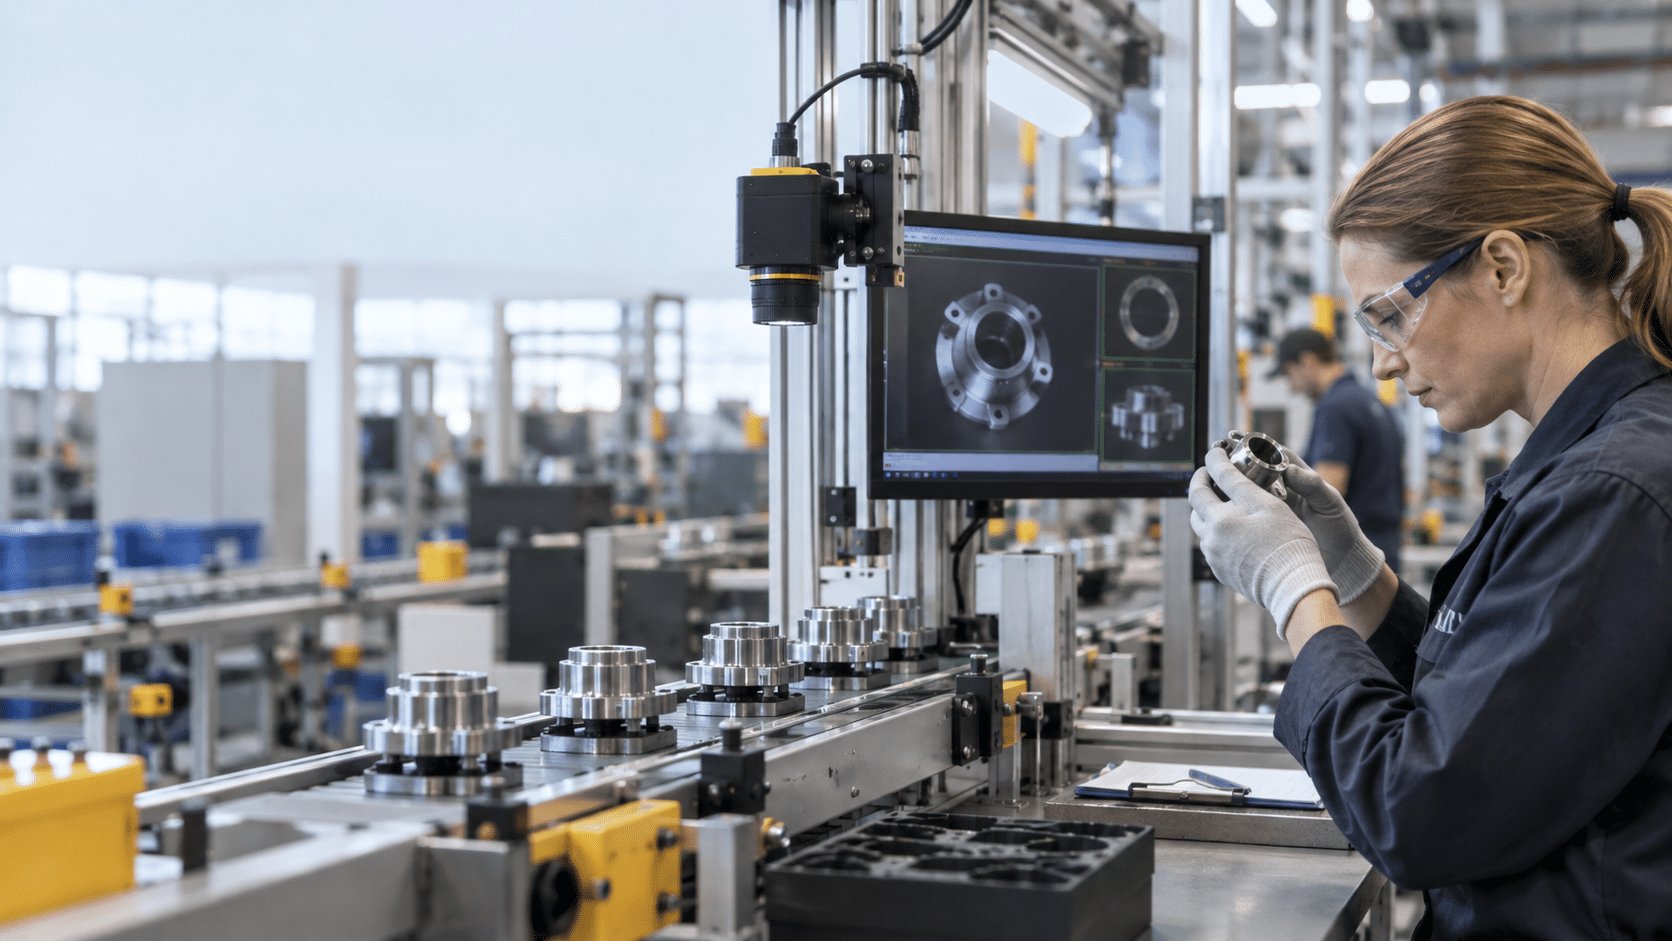
Jeff Zeller | October 16th, 2026
Sandia National Labs found that even in the best case, manual inspectors catch only 80 percent of defects, which means 20 percent of real defects escape the line. That single number explains why so many manufacturing, quality, and operations teams are re-examining how they inspect product before it ships. The decision between manual line checks and automated visual inspection systems comes down to a few measurable factors: how many defects each method actually catches, how fast it runs, what it costs, and what happens when either approach misses something. The figures below come from several independent sources, and they don’t always agree with each other, so each one is attributed to where it came from rather than blended into a single average.
What a Defect Escape Rate Actually Measures
A defect escape rate is simply the share of real defects that make it past inspection and out the door. Containment rate is the inverse: the share caught before shipment. Every inspection method, human or automated, can be scored on this one number.
Oxmaint reports manual visual inspection typically catching 60 to 80 percent of defects on a good day, while automated inspection with computer vision consistently detects 95 percent or more. Instrumental cites a separate benchmark from Sandia National Labs: At best, you will catch 80% of defects, which means 20% of real defects will escape. Elementary puts automated detection rates as high as 99.5 percent in some deployments.
These numbers come from different studies, different industries, and different inspection setups, so they shouldn’t be averaged into one universal figure. What they show consistently is a gap: manual inspection tends to land somewhere in the 60 to 80 percent range, and automated inspection tends to land in the mid-90s to high-90s. Where your own line falls depends on part complexity, defect type, and how the inspection is actually staffed and run.
Detection Accuracy, Fatigue, and Duplicate Inspection
Human inspectors don’t hold a steady detection rate through a shift. Oxmaint’s research points to a measurable drop in accuracy after roughly two hours on repetitive visual tasks, which tracks with what most quality managers already suspect about long inspection shifts. Automated systems don’t have this problem in the same way. They apply the same criteria to the first part of the day and the last, without a fatigue curve.
To compensate for fatigue and individual variation, manufacturers often stack inspectors. Instrumental notes that running inspection in duplicate raises containment to about 96 percent, triplicate pushes it to 99.2 percent, and quadruplicate reaches 99.84 percent. That sounds like a strong fix, but it comes with diminishing returns and real cost, since each added layer means another set of wages and another shift to schedule.
Even stacked manual inspection doesn’t close the gap entirely. In a head-to-head comparison, Instrumental found that 4.6% of units that had passed three operators had real defects intercepted by Instrumental. Three human inspectors in a row still let real defects through that an automated system caught. That’s not a criticism of any individual inspector’s skill; it’s a structural limit of relying on repeated visual judgment calls under time pressure.
Inspection Speed and Line Throughput
Speed is where the gap between methods is most visible on the floor. Oxmaint puts manual inspection at roughly 1 to 5 parts per minute per inspector, versus 100 to 1,000-plus parts per minute per camera for automated inspection. That’s not a marginal improvement; it’s a different order of magnitude, and it’s part of why high-volume lines lean toward automation even before cost enters the conversation.
Elementary’s research shows similar gains in specific industries. Machine vision reduced inspection times by 50 percent in automotive manufacturing compared to traditional methods, and AI-enhanced systems cut inspection time by 60 percent in semiconductor production. One of the more striking examples: turbine blade inspection dropped from 45 minutes to just 3 minutes per blade, letting the same labor force inspect 15 times more blades. Throughput gains like that change what a plant can realistically inspect at all, since 100 percent inspection of every unit is often impractical at manual speeds.
Labor Cost Versus Capital Investment
Manual inspection is a recurring labor cost, and it adds up quickly. Instrumental estimates inspection labor in the US or Europe at $30 to $45 per hour, which comes to roughly $187,000 per year for two eight-hour shifts, five days a week. Add duplicate or triplicate inspection to raise containment, and that figure climbs to $375,000 to $561,000 per year, before overtime.
Automated inspection shifts the cost structure from labor to capital. Oxmaint reports automated inspection stations running $15,000 to $150,000-plus per station upfront, covering hardware and integration, with an ongoing cost of $0.001 to $0.01 per part after setup. Compare that to $0.10 to $0.50-plus per part for manual labor, and the per-unit gap only widens as volume grows. Elementary separately estimates labor savings from automation reaching up to $200,000 per system annually in some deployments. None of these figures reflect what any specific vendor charges, including Matroid, since actual platform pricing depends on scope, deployment, and the specifics of a given line.
What an Escaped Defect Costs After It Leaves the Line
The cost of a defect isn’t fixed. Oxmaint cites a widely used 1-10-100 rule of quality: roughly $1 to catch a defect internally, $10 once it reaches the customer, and $100 or more once it reaches the field. The later a defect is caught, the more expensive it gets, and manual inspection tends to catch problems later than automated systems do simply because it runs slower and misses more on the first pass.
Oxmaint also reports that 30 to 50 percent of customer complaints trace back to defects that had already passed manual inspection, which is a direct link between escape rate and downstream cost.
Oxmaint’s worked example makes the math concrete. A packaging plant shipping 2 million units a year at a 0.5 percent defect rate, with 70 percent manual detection, lets roughly 3,000 defective units reach customers annually. At $25 average cost per escape, covering returns, replacements, credits, and freight, that’s $75,000 a year in avoidable cost, before counting brand damage or lost contracts. An automated inspection cell at 96 percent detection cuts those escapes to roughly 400 units, saving about $65,000 a year, with payback in under 12 months in that scenario.
Where Manual Line Checks Still Make Sense
Automated inspection isn’t the right call for every line. Manual inspection still makes sense when volumes are low, when defect criteria are subjective, or when a part needs expert judgment on an unusual or one-off case, according to a readiness guide from Zetamotion. Low-volume runs often don’t justify the setup time or capital cost of an automated station, and some defect categories, like an aesthetic finish judgment, are genuinely hard to reduce to a trained model.
Automated systems are also only as good as the defect classes they’ve been trained on. A novel defect type that falls outside the training set can slip through, which is why Averroes and other sources point to undefined or new defect classes as a known weak point. Direct visual inspection needs no hardware and handles complex aesthetic judgment intuitively, but human inspectors fatigue, drift in their criteria over a shift, and leave no traceable record unless someone logs results deliberately.
In practice, many lines land on a hybrid model rather than an all-or-nothing switch. Averroes recommends automated 100 percent inspection on critical features, paired with manual sampling on aesthetics, an approach that keeps human judgment where it’s genuinely needed while using automation where volume and consistency matter most. Matroid’s no-code computer vision platform fits this kind of hybrid setup well, since it lets quality and operations teams build detectors for defined defect classes, hazards, or assembly checks, using its custom detector studio and any existing camera or video hardware, without waiting on a data science build cycle.
The Escape Risk That Doesn’t Disappear With Automation
Moving to automated inspection doesn’t eliminate escape risk, it changes its shape. Automated systems can still miss defects that require subjective human judgment, such as surface feel, color nuance, or aesthetic inconsistencies that don’t reduce cleanly to a visual pattern. Even highly automated factories typically retain human oversight for edge cases, subjective evaluations, and system supervision rather than removing people from the process entirely.
How a manufacturer should validate a system’s true detection rate on its own line before full rollout, and how it should monitor for missed defects after go-live, isn’t addressed consistently across the available research. What evidence exists points to this being vendor-dependent and deployment-specific rather than a standardized procedure, so plan on treating validation and ongoing monitoring as decisions to work through with whichever vendor you choose, not as a solved problem with one universal answer.
One traceability advantage does show up clearly in the research: automated inspection produces an auditable, logged record of results as a byproduct of running, distinct from manual sign-off sheets that depend on someone filling them out consistently. That’s a useful operational benefit for tracking what was inspected and when, though it shouldn’t be read as a claim about legal or compliance outcomes, since those depend on far more than inspection records alone.
Estimating Your Own Defect Escape Cost
The worked example above, 2 million units a year, a 0.5 percent defect rate, 70 percent manual detection, and $25 average cost per escape, is illustrative for that specific plant. It’s not a universal formula, but the arithmetic behind it is easy to adapt. Take your own annual unit volume, your current defect rate, and your current detection rate, run the same calculation, and you’ll get a rough estimate of what your line’s escapes are actually costing today.
Once you have that number, compare it against what automation would cost, using the upfront station price and per-part cost figures from the labor and capital section above. Oxmaint’s rule of thumb is that when annual escape cost plus inspection labor cost exceeds roughly 1.5 times the automation system’s price, payback typically lands somewhere in the 12 to 24 month range. That threshold gives you a quick sanity check before committing to a full evaluation or requesting quotes from any vendor.
Verdicts by Line Type and Volume
High-volume lines with tight tolerances and a measurable escape cost are the clearest case for automated visual inspection. The throughput, per-part cost, and stable detection figures covered above all favor automation once volume is high enough to make the upfront investment pay back within a reasonable window.
Low-volume runs, or lines where defect criteria are genuinely subjective, still favor manual inspection or a hybrid setup. There’s less to gain from automating a process that doesn’t run at scale, and aesthetic judgment calls remain hard to fully automate.
Lines with a mixed defect population, some defect types well defined and consistent, others novel or unusual, tend to do best with a stack: automated inspection on critical, well-defined features, and manual review on aesthetics and edge cases. Industry adoption data backs up that this is where most manufacturers are actually heading. A 2025 ETQ survey found 49 percent of manufacturers plan to implement AI in the next two years, 33 percent already use it, and only 1 percent report no plans for AI adoption at all. For teams weighing that transition, Matroid’s platform supports this kind of staged, hybrid rollout: detectors can be trained and deployed on specific defect, hazard, or assembly checks using any camera setup already on the line, with MLOps architecture and analytics from video streams to monitor performance as coverage expands.
TL;DR
Manual visual inspection typically catches 60 to 80 percent of defects, with a best-case ceiling of 80 percent per Sandia National Labs, so teams evaluating automated visual inspection systems should compare detection rate, throughput, cost, and failure consequences using attributed, source-specific figures rather than blended averages.
Building Custom Computer Vision Models with Matroid
Dive into the world of personalized computer vision models with Matroid's comprehensive guide – click to download today